Cause Effect diagram is a popular technique to establish the root cause(s) of a problem. A cause-and-effect diagram is a visual representation to find out one or more causes of a specific problem. It allows exploration of possible causes. People use it to correct defects in their products or services. Other names for the cause and effect diagram are cause effect graph, herringbone diagram, ishikawa diagram and fishikawa (because it looks like the bones of a fish).

If you want to learn more, please see my cause effect video in my Software and Testing Training channel or read on...
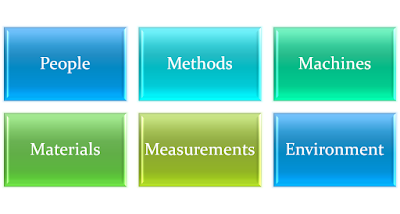
In cause effect graphing technique, you put the effect in the head, categories as branches from the backbone and causes as branches of the appropriate category. You can use the following categories:

You can learn what is cause effect analysis with this cause effect analysis example in detail using the Cause and Effect Analysis tutorial.
Cause Effect Diagram Template

If you want to learn more, please see my cause effect video in my Software and Testing Training channel or read on...
In cause effect graphing technique, you put the effect in the head, categories as branches from the backbone and causes as branches of the appropriate category. You can use the following categories:

The steps of cause and effect analysis are as follows:
- You assemble the stakeholders.
- As a group, you identify the problem (the effect in cause effect).
- The facilitator writes the problem statement as a question. The facilitator draws the diagram with the effect (in the head) and cause categories (in branches from the backbone).
- As a group, you brainstorm about possible causes of the effect; the facilitator puts each cause (as a branch) in the appropriate category.
- The group asks why about each cause; this leads to sub-causes (sub-branches).
- The group analyzes and prioritizes the causes.
- The facilitator highlights the top cause.
- The group validates the top cause; if it proves to be the real cause, then you address it else move to the next top cause in the cause effect diagram.

You can learn what is cause effect analysis with this cause effect analysis example in detail using the Cause and Effect Analysis tutorial.

No comments:
Post a Comment
Note: Only a member of this blog may post a comment.